Bobalytics
Bobalytics provides analytics and insights into how IBM Bob contributes to your software development process. Use it to understand Bob's impact on your codebase, track Bobcoin spending, and monitor team adoption across your organization.
Accessing Bobalytics
Bobalytics is available exclusively for Enterprise plan users.
Open Bobalytics from the IBM Bob web portal.
Go to bob.ibm.com and log in.
Click Admin, then select the Bobalytics tab.
Navigating Bobalytics
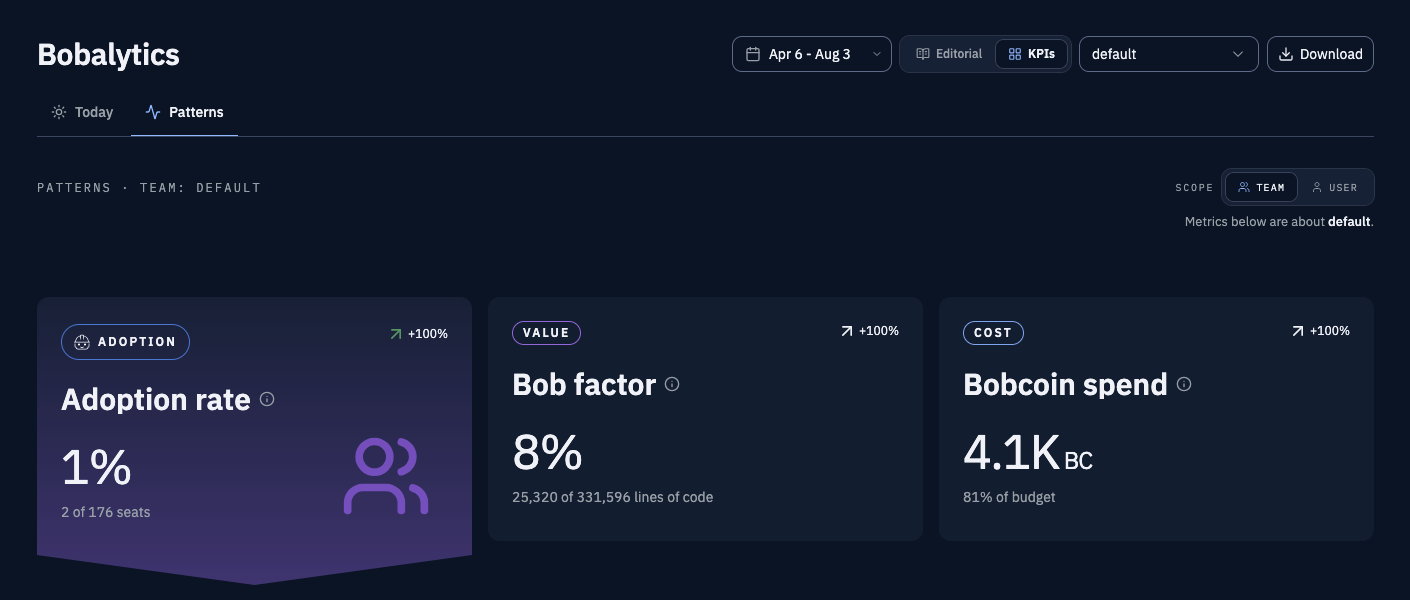
Bobalytics has two main tabs: Today and Patterns
Admins can only view their own data on the user view. The user view does not provide access to other users' individual data.
Filtering data
Use the time range selector to control the period covered by all charts. Charts update dynamically to reflect the selected range. The previous-period comparison shown on each key performance indicator (KPI) card is calculated automatically based on an equivalent period immediately before your selection.
In the Patterns tab, you can also use the Teams dropdown to select one or more teams and aggregate data across them.
Key performance indicators
The KPIs view in Patterns organizes analytics around three key performance indicators: Adoption rate, Bob factor, and Bobcoin spend. Select a KPI to see its primary charts and supporting metrics.
Adoption rate
Adoption rate measures how consistently your team uses Bob. It is calculated as the average number of daily active users divided by the total number of licensed seats. A user is counted as active on a given day when they accept at least one code completion or complete a chat conversation.
Primary metrics:
- Team onboarding: the adoption percentage for specific teams.

- Daily active users: a chart of active users over time with a toggle between daily and weekly views.

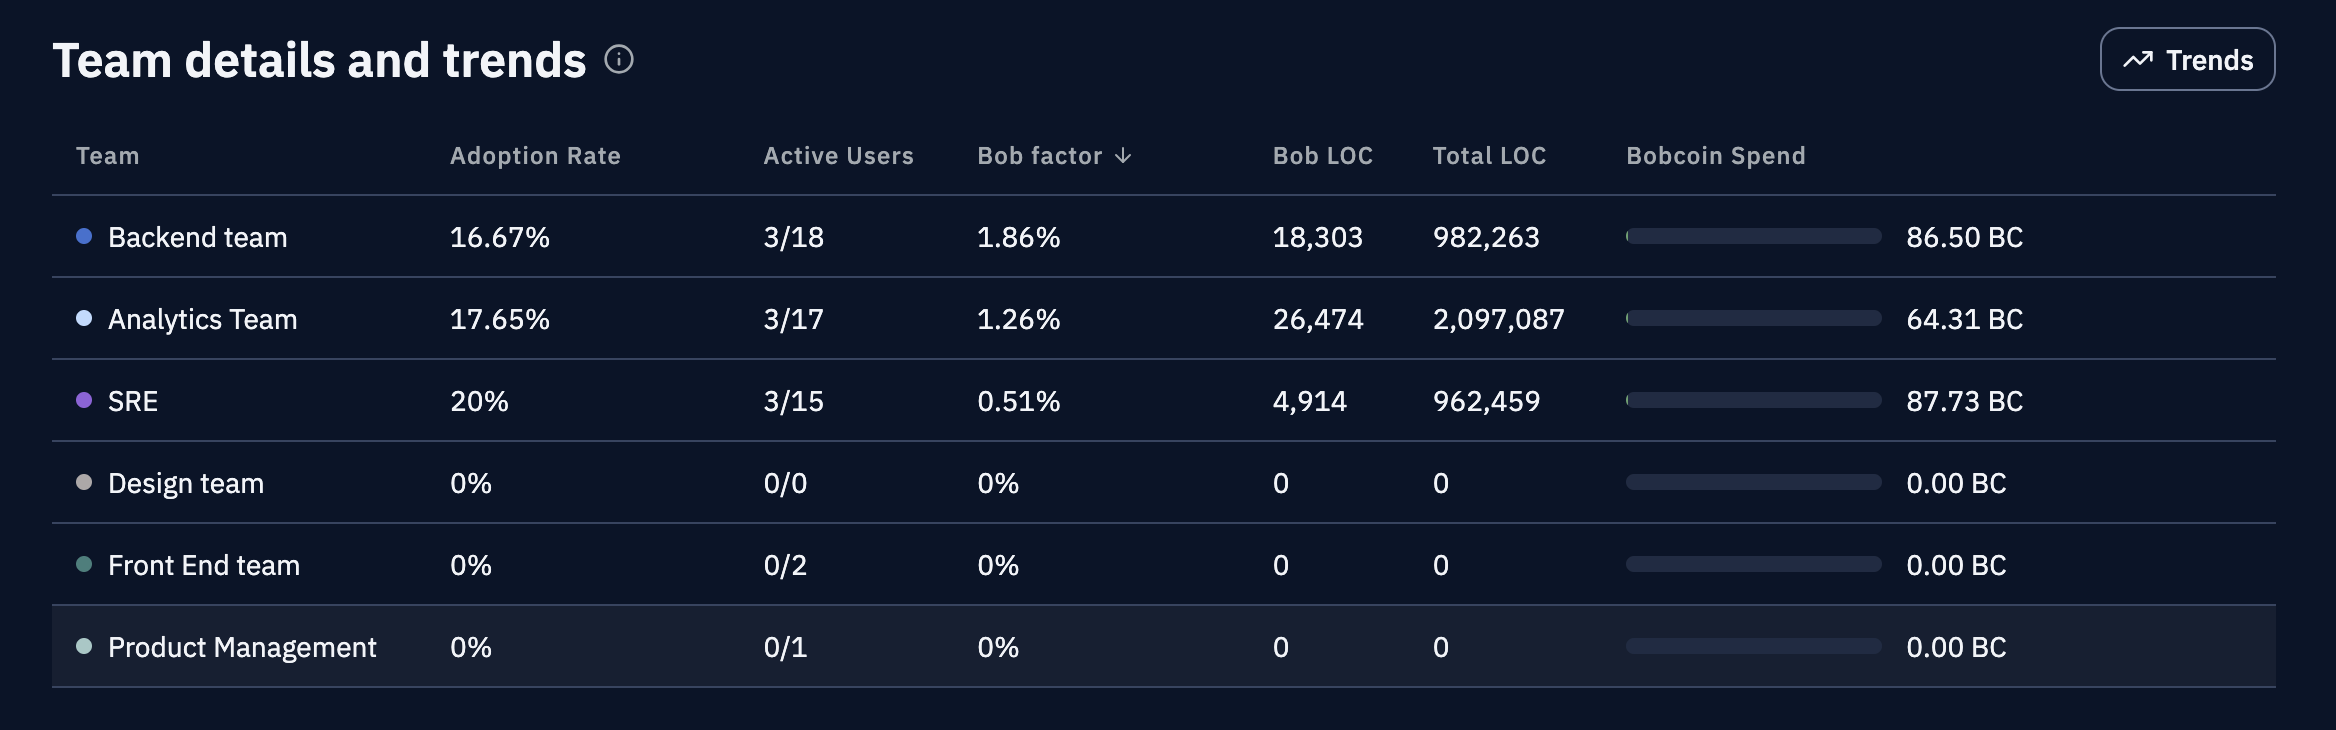
- Team details and trends: Adoption, value, and cost metrics.

Supporting metrics:
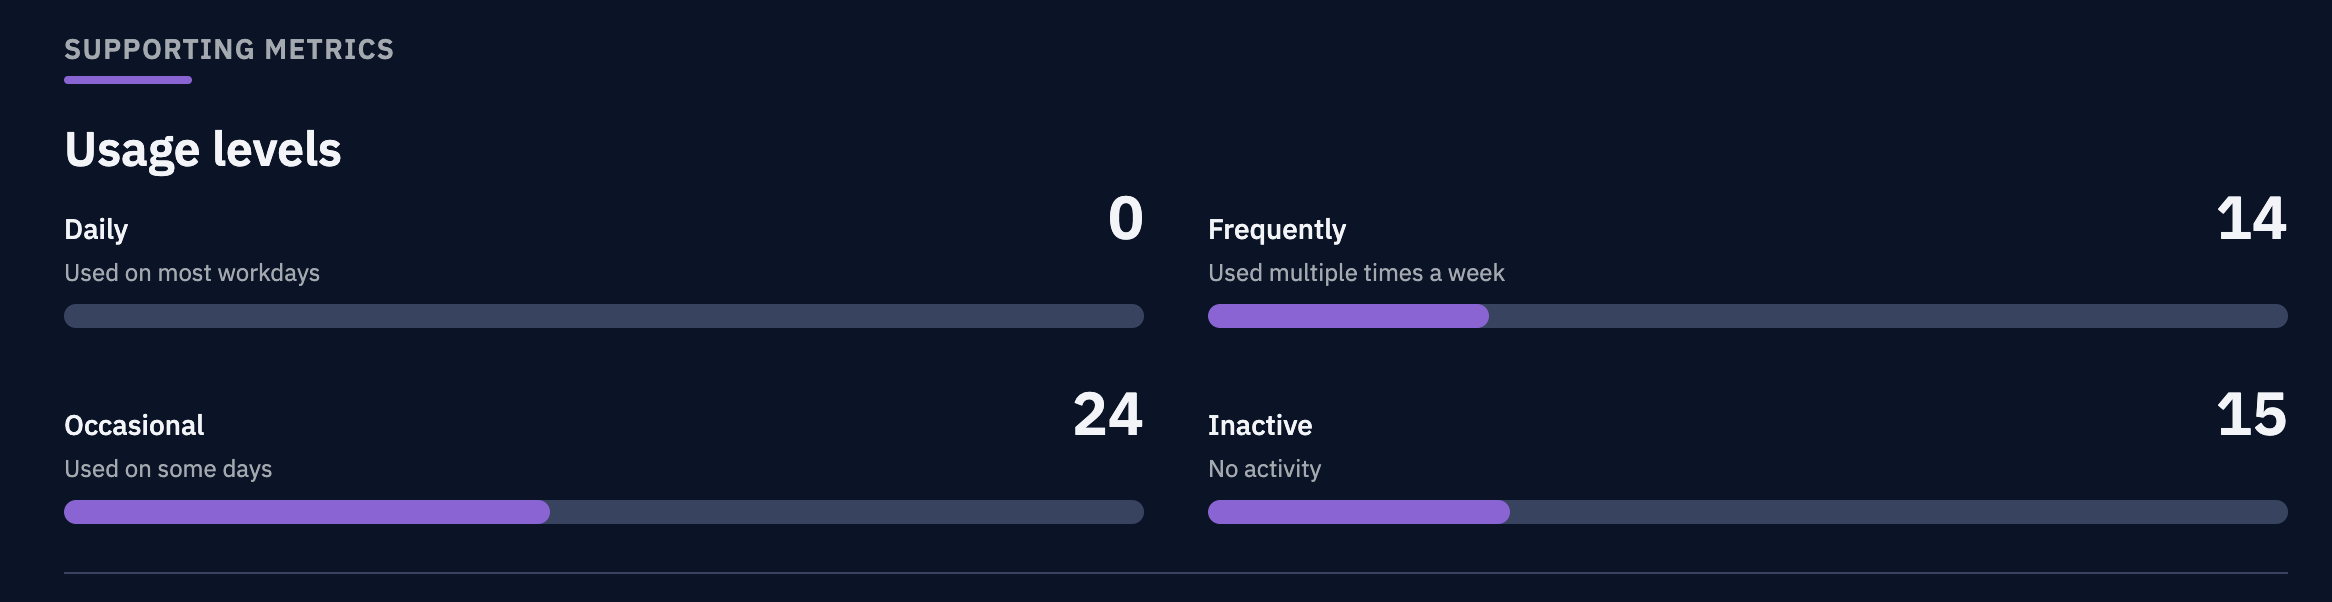
- Usage levels: a breakdown of users by how often they use Bob—multiple times per day, daily, weekly, occasional, or inactive.
- Bob's repository impact: Repositories where Bob users have been most active.
You can click each chart component to learn more information about a specific metric.
If adoption rate is low, check usage levels to identify inactive or occasional users. Reaching out to those users or reviewing their onboarding can help bring adoption up before the end of a billing cycle.
Bob factor
The Bob factor measures Bob's contribution to your codebase. It is the percentage of committed lines of code that Bob created.
Formula: Lines of code committed by Bob ÷ total lines of code committed
To ensure metric accuracy, the Bob factor calculation excludes commits with zero lines from Bob when the total exceeds 40,000 lines of code. These large commits typically consist of template code, dependency files, or test fixtures that would otherwise skew the result.
Excluded commits are not deleted; they still appear in the repository list and in all other telemetry.
Primary metrics:
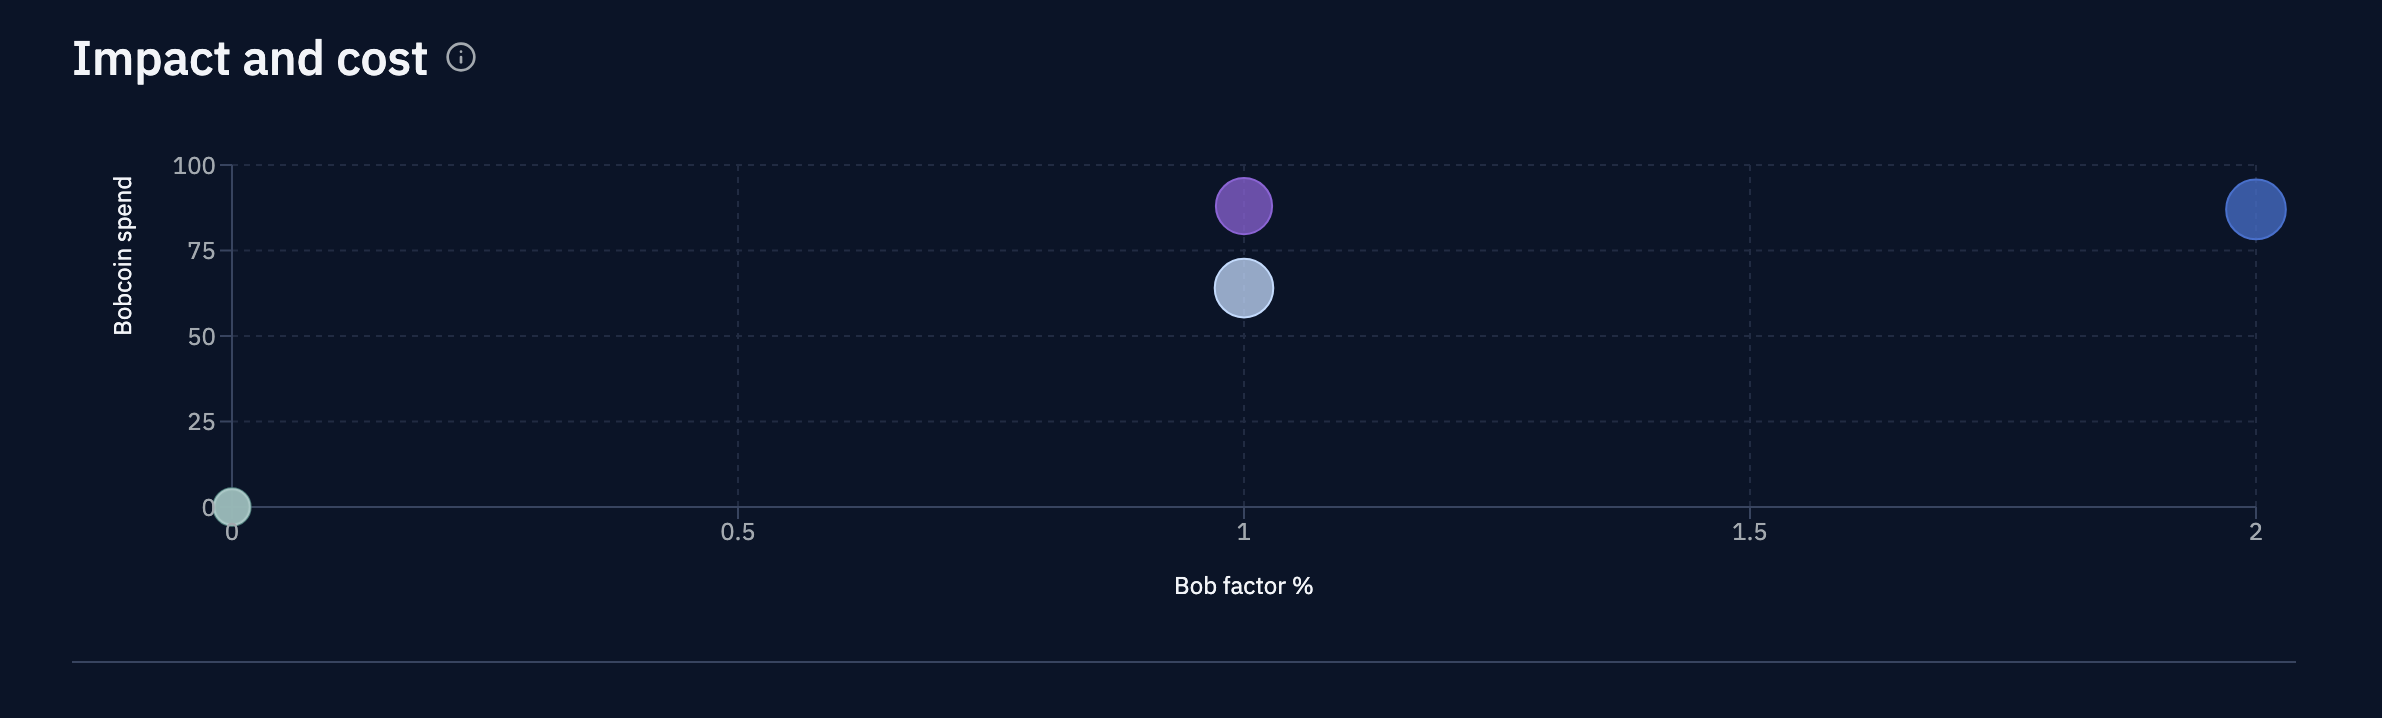
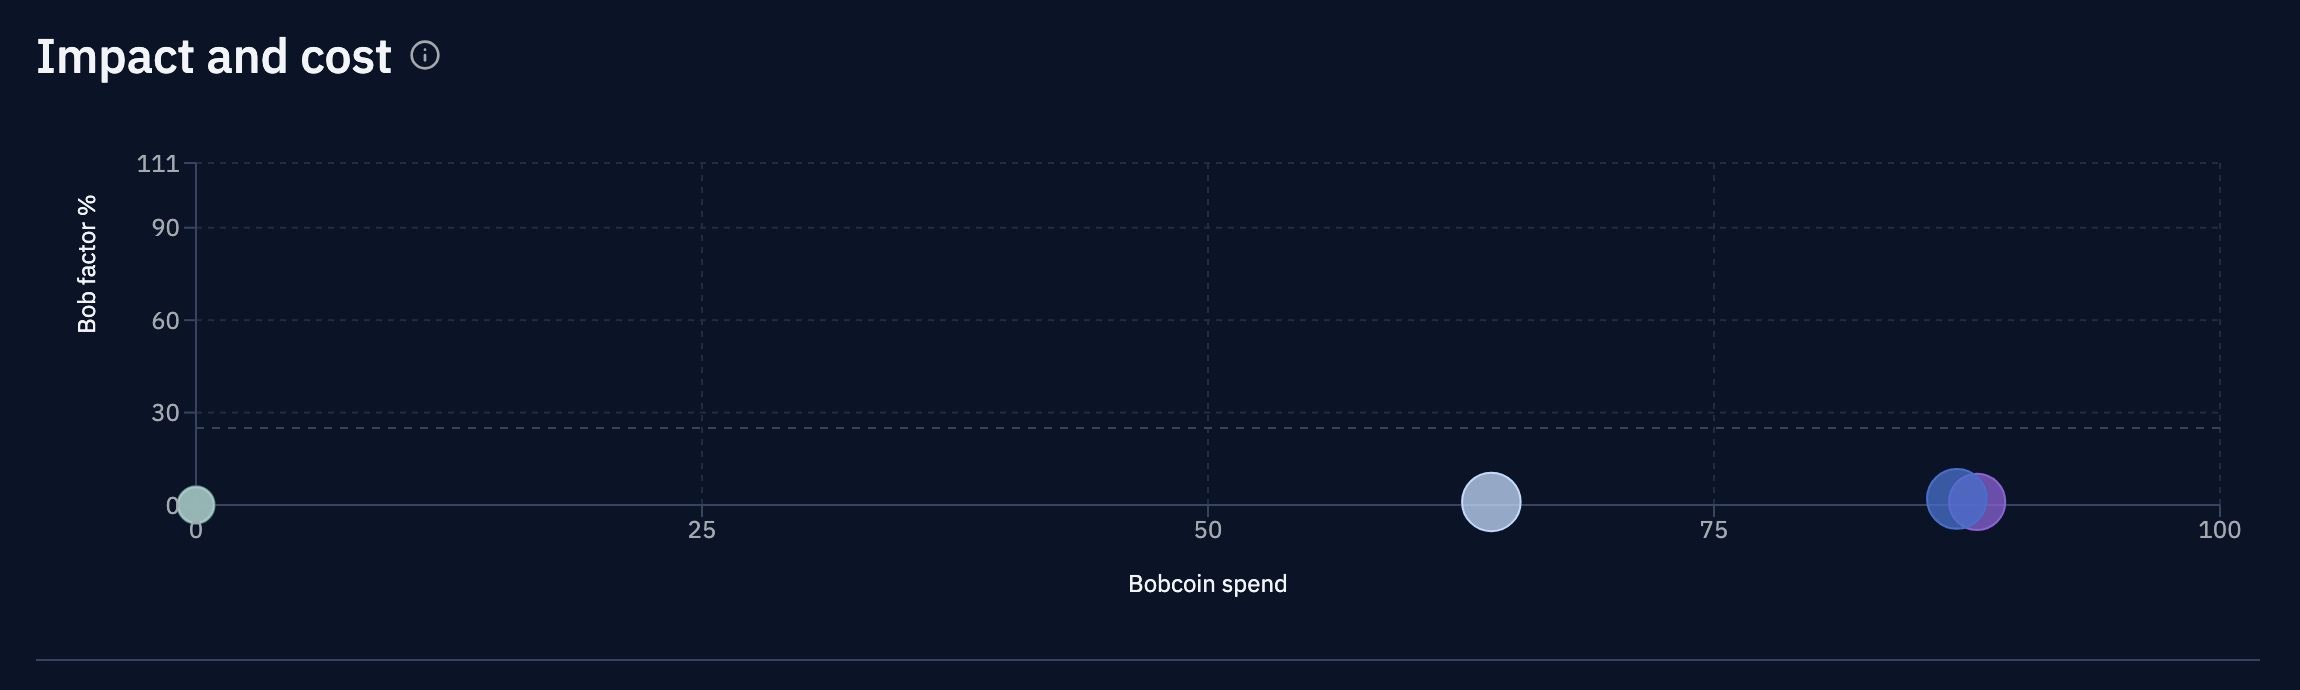
- Impact and cost: How each team's Bob factor compares to their Bobcoin spend.
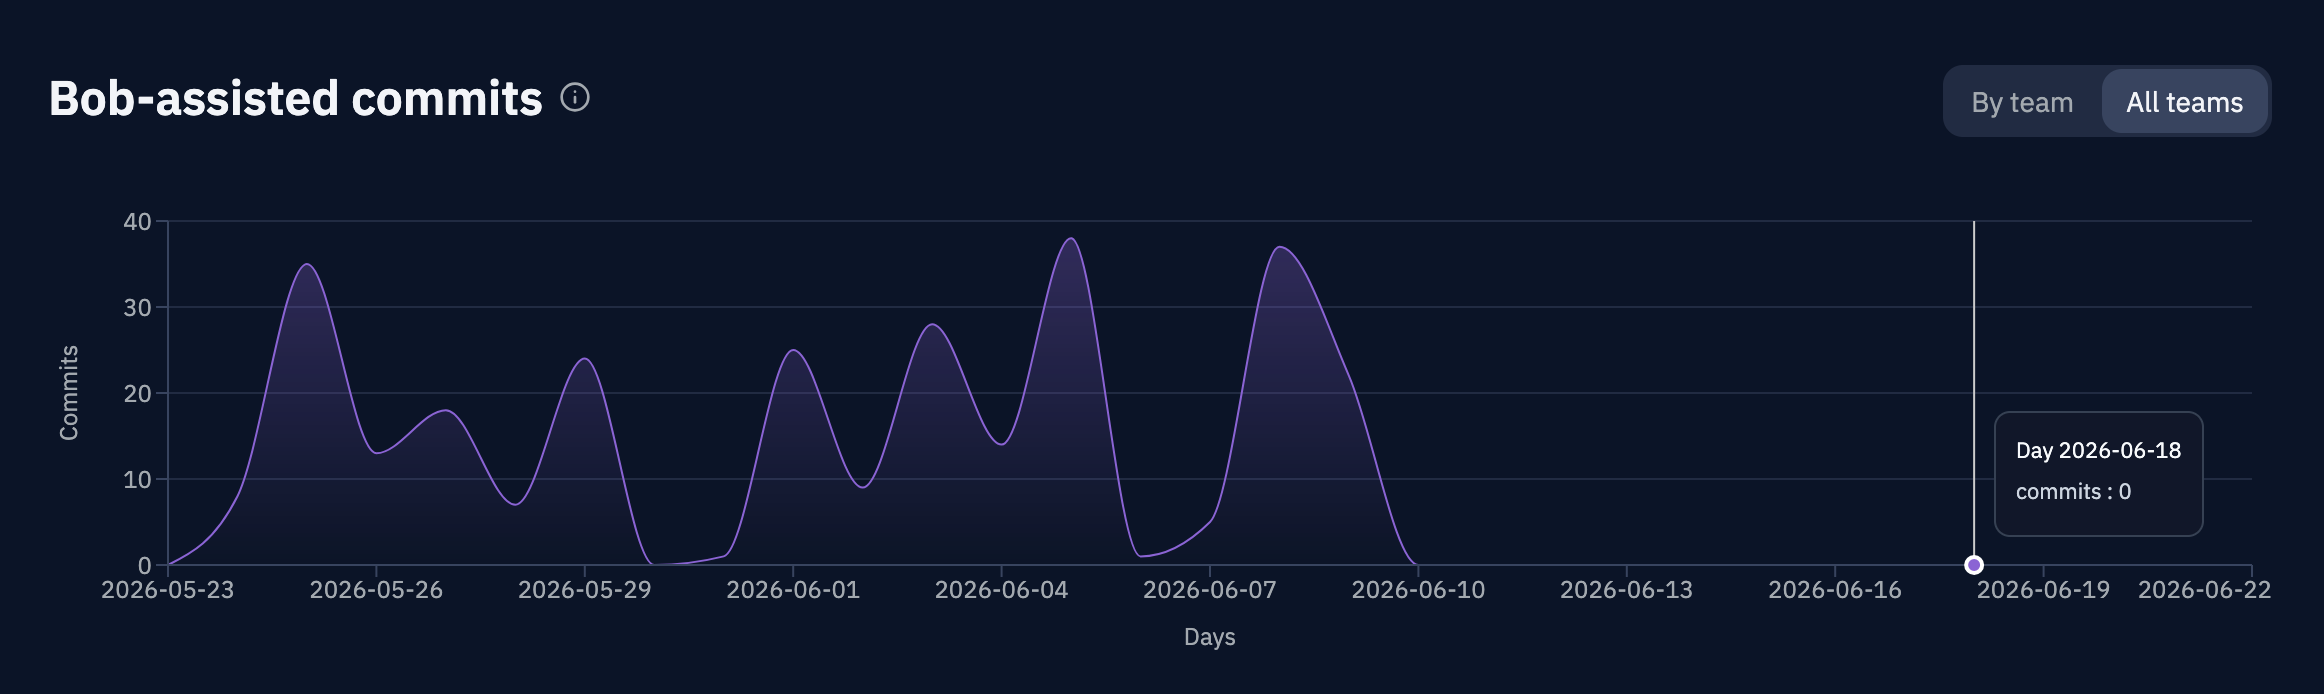
- Bob-assisted commits: a line chart of commits over the selected period, with a toggle to select either by team or all teams.
- Team details and trends: Adoption, cost, and metrics per team.
Supporting metrics:
- Bob's repository impact: Repositories where Bob users have been active.
Use Bob factor alongside Bobcoin spend to assess efficiency. A team with a high Bob factor and low spend indicates Bob is being used effectively. A high spend with a low Bob factor may indicate Bob is being used heavily for tasks that don't produce committed code, such as research, explanation, or exploration.
Bobcoin spend
Bobcoin spend tracks the total Bobcoins consumed over the selected period.
Primary metrics:
- Impact and cost: How each team's Bob factor compares to their Bobcoin spend.
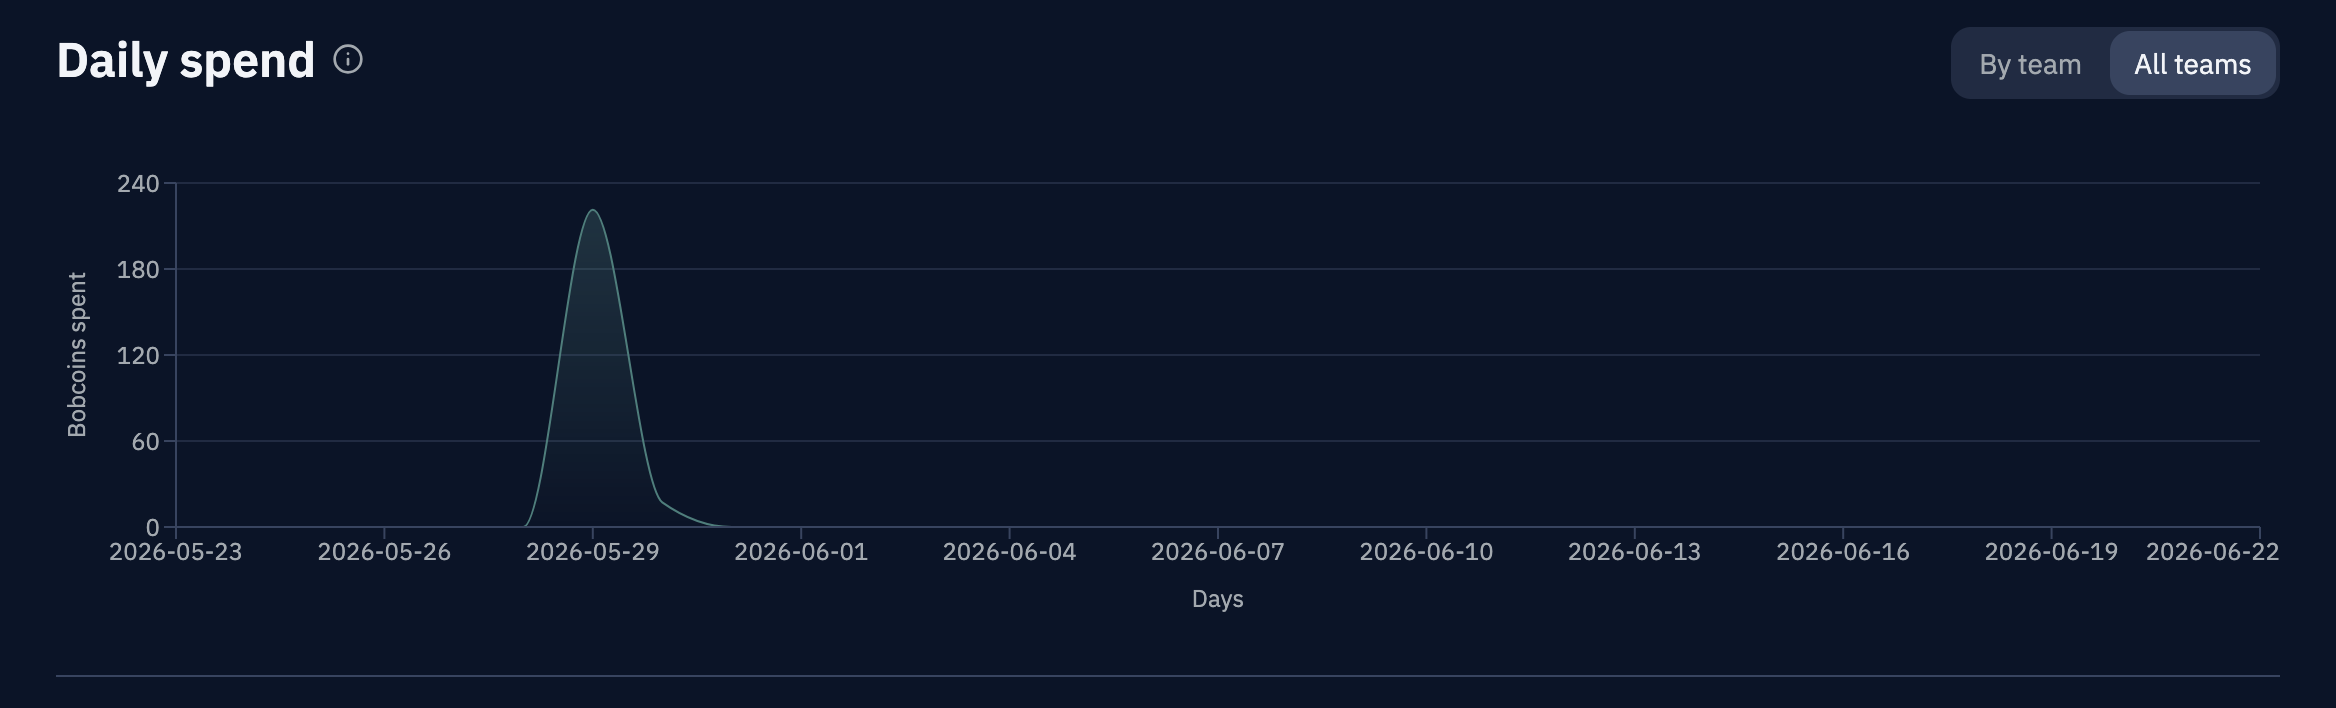
- Daily spend: Bobcoins spent per day.
- Team details and trends: Adoption, value, and cost metrics per team.

Supporting metrics:
- Bob's repository impact: Repositories where Bob users have been active.
If a team is consuming Bobcoins faster than expected, review their adoption rate and Bob factor alongside spend. High spend paired with high adoption and a strong Bob factor suggests effective use. High spend with low Bob factor may indicate an opportunity to review how Bob is being used within that team.
Using Bobalytics effectively
The three KPIs in Bobalytics work together to give you a complete picture of Bob's value across your organization.
| Goal | KPI to focus on |
|---|---|
| Understand how many people are actively using Bob | Adoption rate |
| Measure Bob's tangible contribution to shipped code | Bob factor |
| Monitor and control AI tooling costs | Bobcoin spend |
| Assess efficiency (value vs. cost) | Bob factor + Bobcoin spend together |
Reviewing data regularly
Check Bobalytics on a regular cadence — weekly or monthly — to spot trends before they become problems. For example:
- A declining adoption rate over several weeks may signal that users need additional enablement or that workflows need adjustment.
- A sudden spike in Bobcoin spend can be investigated by filtering down to a specific team or time range to identify the source.
- A steadily rising Bob factor alongside stable spend is a strong signal that your team is getting increasing value from Bob over time.
Sharing insights with stakeholders
The Patterns tab aggregates data across all teams, making it useful for reporting to leadership or justifying AI tooling investment. Filter by specific teams to create targeted reports for team leads or project owners.
To export data, select Export in the top right of any Bobalytics view. Choose the tables to include. Each table is saved as a separate CSV file in a ZIP archive. Available tables include:
- Bob factor compared with team
- Bob's repository impact
- Most frequently used modes
- Bob's code contribution by language
For more on managing Bobcoin budgets and understanding how spend accrues, see Bobcoins.
Privacy and data visibility
Bobalytics is designed to provide team-level insights without exposing individual user data to admins.
- User-identifying information, such as email addresses, in team-level charts is anonymized and shown as User 1, User 2, and so on.
- Admins cannot access a specific user's data from any team-level chart.
- Each user can view their own individual data on the User view page.
Skills
Create reusable instruction sets for specialized workflows. Define custom workflows, add supporting files, and teach Bob specialized tasks for consistent results.
Signing in
How authentication works in IBM Bob, including IBMid login, SSO with a company identity provider, and what to expect when your organization moves to single sign-on.